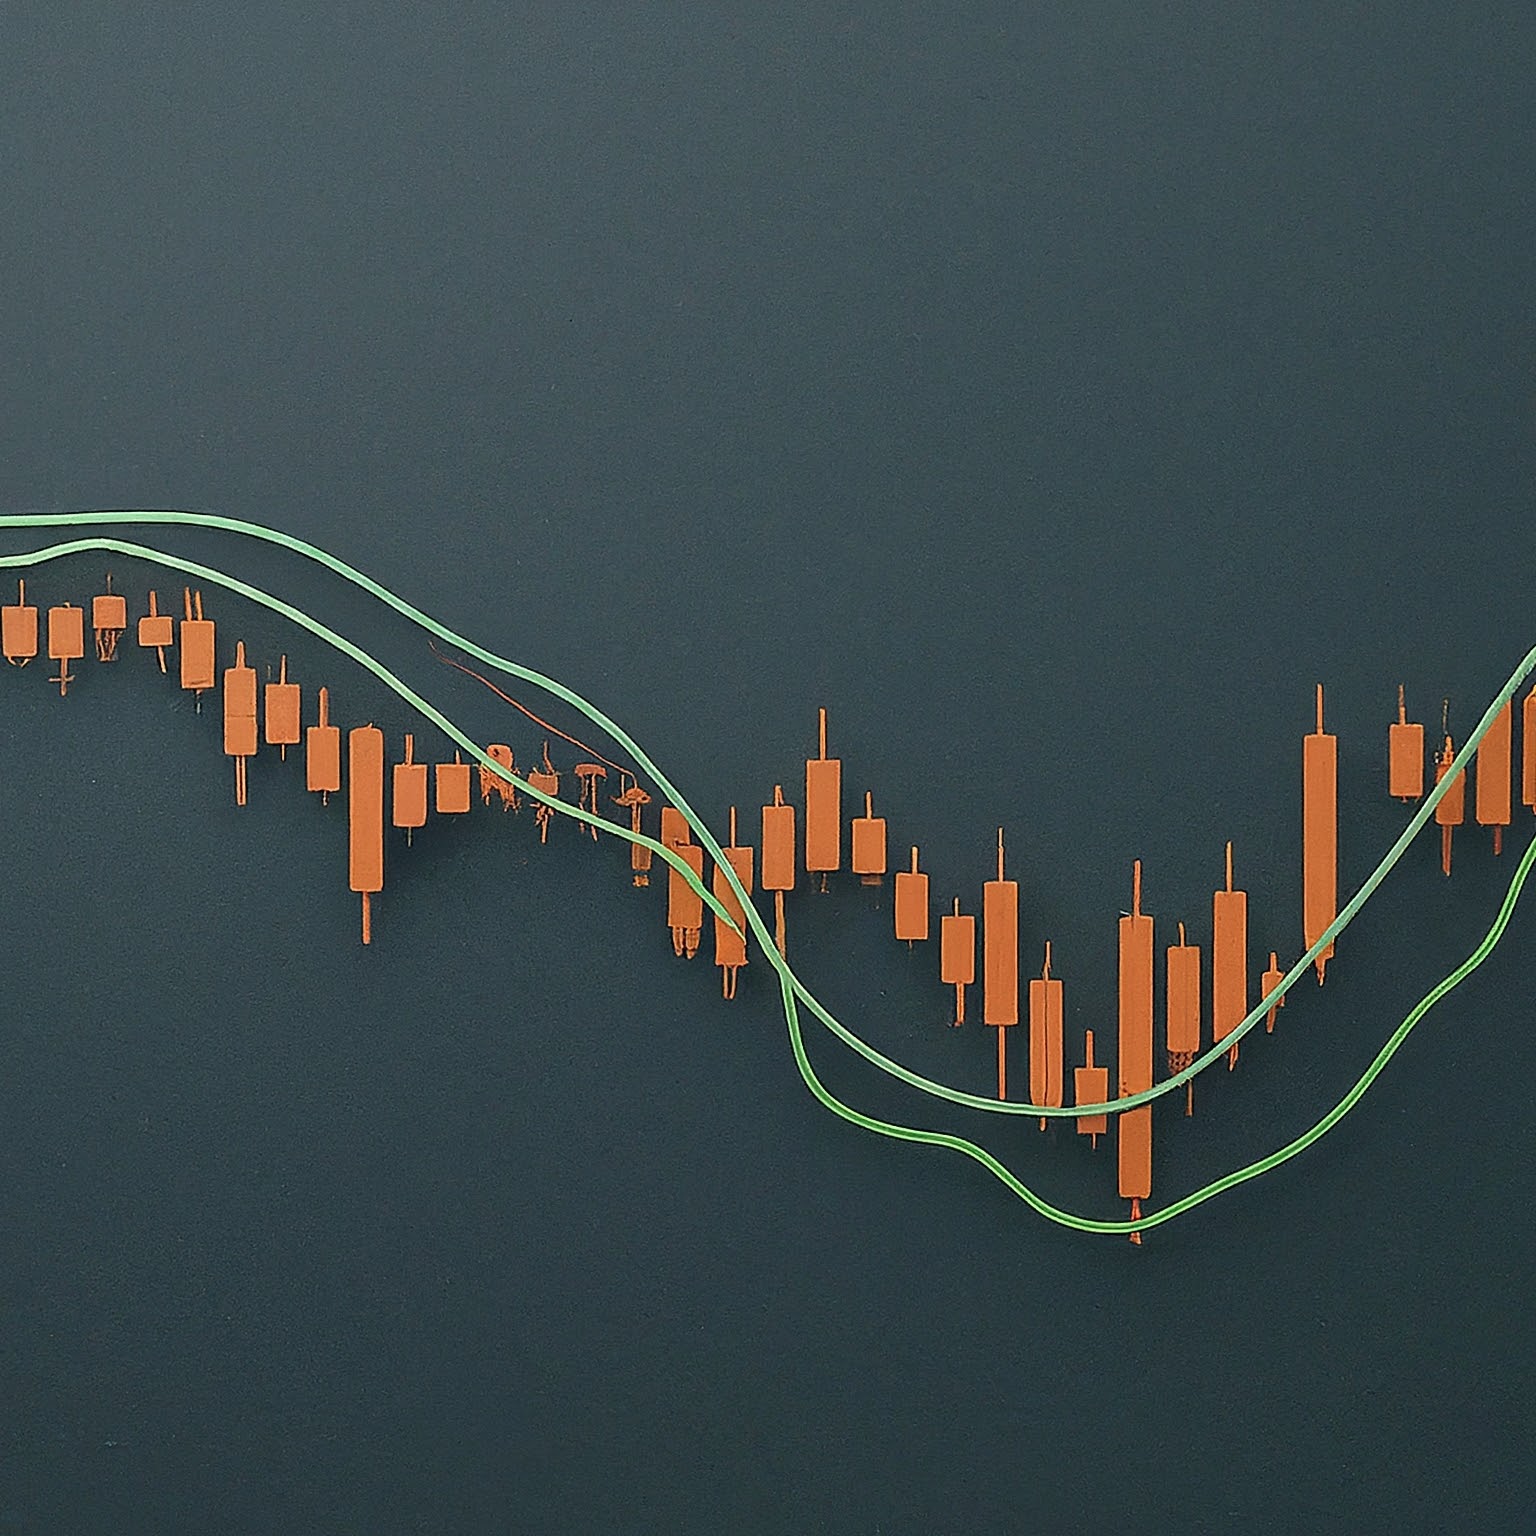
In the world of financial trading and investment, the use of technical analysis tools is a common strategy for predicting future market movements. Among the myriad tools available, moving averages stand out for their simplicity, effectiveness, and flexibility. This article will guide you through the basics of moving averages, their types, and practical applications, particularly for newcomers looking to get their feet wet in technical analysis.
What Are Moving Averages?
At its core, a moving average (MA) is a statistical calculation used to analyze data points by creating a series of averages of different subsets of the full data set. In the context of financial markets, a moving average smooths out price data by creating a constantly updated average price. This is particularly useful in financial markets as it helps to mitigate the fluctuations and noise, providing a clearer view of the direction in which the market is moving.
Types of Moving Averages
There are several types of moving averages that are commonly used in trading and analysis:
Simple Moving Average (SMA)
The simple moving average is the most basic form of the moving averages used in trading. It is calculated by adding up the closing prices of the asset over a certain number of periods and then dividing this total by the number of periods. For example, a 20-day SMA would add up the closing prices of the past 20 days and divide by 20 to find the average.
Exponential Moving Average (EMA)
The exponential moving average is a type of moving average that places a greater weight and significance on the most recent data points. Unlike the simple moving average, the EMA gives a higher weight to recent prices, which makes it more responsive to new information. This can be particularly useful in fast-moving markets.
Weighted Moving Average (WMA)
The weighted moving average is similar to the EMA in that it gives more weight to recent data. However, the calculation is different. The WMA multiplies each data point by a weight, and the weights decrease in a linear fashion as the data points become older. For example, in a 10-day WMA, the most recent day might be multiplied by 10, the next day by 9, and so on, down to 1.
Why Use Moving Averages?
Moving averages are a staple in technical analysis due to their ability to smooth price data and thereby identify trends more easily than by observing raw data. Here are several advantages of using moving averages:
Trend Identification
The primary use of moving averages is to identify the direction of the market trend. When the price of an asset is above its moving average, it is generally considered to be in an uptrend, and when it is below, it is considered to be in a downtrend.
Support and Resistance Levels
Moving averages can also act as levels of support and resistance in the market. During uptrends, the moving average can act as a support level—a price level which the asset does not fall below. During downtrends, it can act as a resistance level—a price level which the asset does not exceed.
Signal Generation
Moving averages can be used to generate trading signals. When a shorter-period moving average crosses over a longer-period moving average, it can be seen as a signal to buy. Conversely, when a shorter moving average crosses below a longer moving average, it may be a signal to sell.
Practical Application of Moving Averages
Here’s how you can start using moving averages in your trading strategy:
Step 1: Choose Your Type of Moving Average
The choice between an SMA, EMA, and WMA depends on your trading strategy. If your strategy relies on reacting quickly to price changes, an EMA might be more appropriate because of its sensitivity to recent price movements.
Step 2: Determine the Period
The period you choose for the moving average should align with your trading goals. Short-term traders might use shorter periods such as 10 or 20 days, while long-term investors might prefer longer periods such as 100 or 200 days.
Step 3: Combine with Other Indicators
While moving averages can be powerful tools, they are often used in conjunction with other technical analysis tools to confirm trends and signals. For example, a trader might use relative strength index (RSI) alongside moving averages to confirm momentum before making a trade.
Step 4: Practice with Historical Data
Before applying moving averages to live trading, practice with historical data. Backtesting your strategy can help you understand how these averages behave with your chosen assets in different market conditions.
Step 5: Implement and Monitor
Once comfortable, implement the moving average strategy in your trading. Continuously monitor its performance and make adjustments as necessary, considering any changes in market conditions or in your trading objectives.
Conclusion
Moving averages are an essential tool in a trader’s arsenal. They are simple yet powerful, suitable for markets ranging from forex to stocks to commodities. By effectively using moving averages, traders can filter out the noise in price movements, identify trends, set up support and resistance levels, and generate trading signals. Whether you are a novice trader or an experienced market player, understanding and utilizing moving averages can significantly enhance your trading strategies.

No Responses